As an instructional design challenge for professional development, I created a high-level overview of a 15-minute course designed to introduce Google Sheets users to pivot tables.
After researching the available features, I clarified my intended audience and determined their most common use cases. I set goals for the course based on these tasks and decided how to introduce the necessary concepts to complete these tasks.
To achieve ambitious goals in just 15 minutes, I decided to structure the course in sections with a brief video followed by short readings to reinforce the concepts, particularly new terminology. To wrap up, I included a quiz as well as space to suggest ways for the user to continue learning.
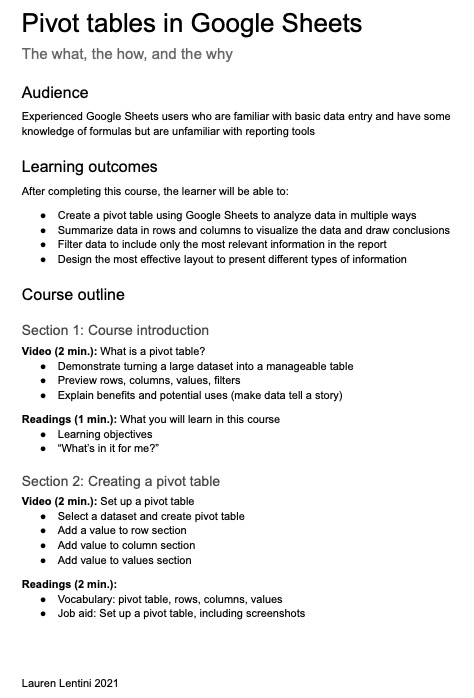
Pivot tables in Google Sheets
The what, the how, and the why
Audience
Experienced Google Sheets users who are familiar with basic data entry and have some knowledge of formulas but are unfamiliar with reporting tools
Learning outcomes
After completing this course, the learner will be able to:
- Create a pivot table using Google Sheets to analyze data in multiple ways
- Summarize data in rows and columns to visualize the data and draw conclusions
- Filter data to include only the most relevant information in the report
- Design the most effective layout to present different types of information
Course outline
Section 1: Course introduction
Video (2 min.): What is a pivot table?
- Demonstrate turning a large dataset into a manageable table
- Preview rows, columns, values, filters
- Explain benefits and potential uses (make data tell a story)
Readings (1 min.): What you will learn in this course
- Learning objectives
- “What’s in it for me?”
Section 2: Creating a pivot table
Video (2 min.): Set up a pivot table
- Select a dataset and create pivot table
- Add a value to row section
- Add value to column section
- Add value to values section
Readings (2 min.):
- Vocabulary: pivot table, rows, columns, values
- Job aid: Set up a pivot table, including screenshots
Section 3: Using filters and sorting
Video (1 min.): Sort and filter to customize data
- Sort table ascending or descending in rows and column
- Add filter value to table and select specific values
- Filter table by condition and set up specific formula
Readings (1 min.):
- Vocabulary: filter, condition, formula, sort, ascending, descending
Section 4: Designing pivot tables
Video (2 min.): Further customize pivot table presentation
- Toggle grand total in rows and columns
- Add additional values to rows or columns
- Rearrange values from rows to columns
- Show values as percentages
- Use alternate summary formulas
Readings (1 min.):
- Vocabulary: Grand total
- Cheat sheet: Summarize formula definitions
Section 5: Conclusion
Knowledge check (2 min.)
Next steps and related courses (1 min.)
